At MaibornWolff, we love good code and want to contribute to the world to help everyone around us have a better codebase. But before you can change anything, you need to identify and talk about the problems in your codebase.
CodeCharta is our attempt to make code more tangible, so that you can communicate with your managers or colleagues about your codebase, analyse it and find hotspots.
Features
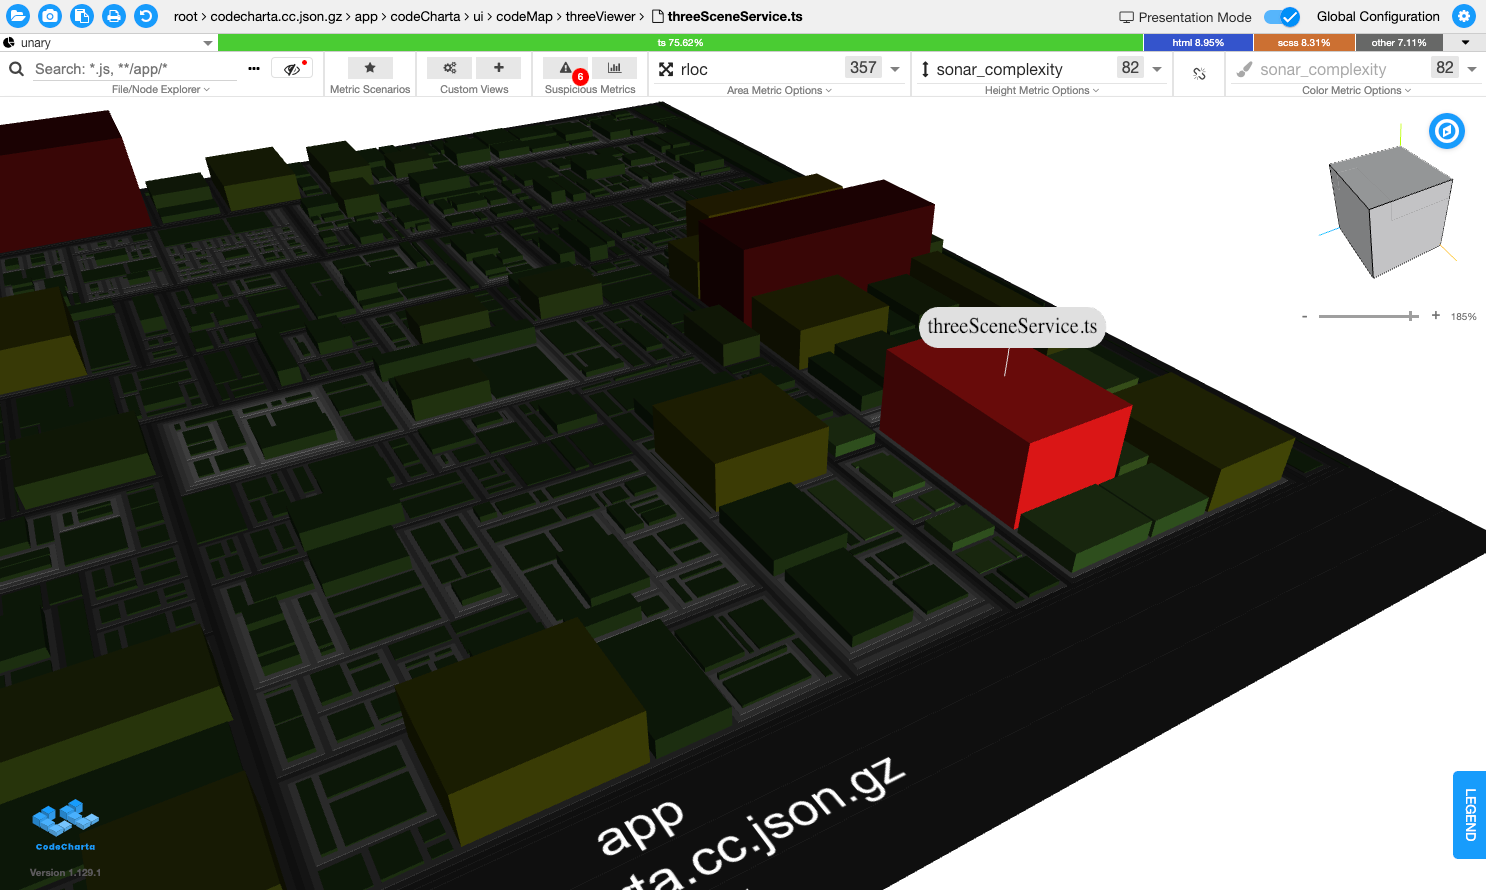
Interactive Visualization
Turn your codebase into a dynamic, city-like map. Navigate through your code with ease and uncover insights you’ve never seen before.
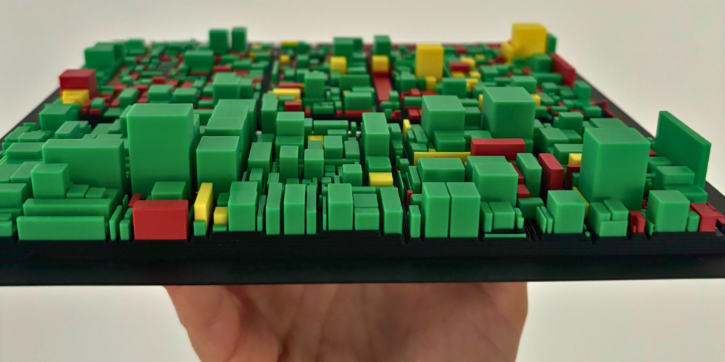
Tangible Models
Bring your code to life! Print your codebase as a 3D model! Perfect for presentations.
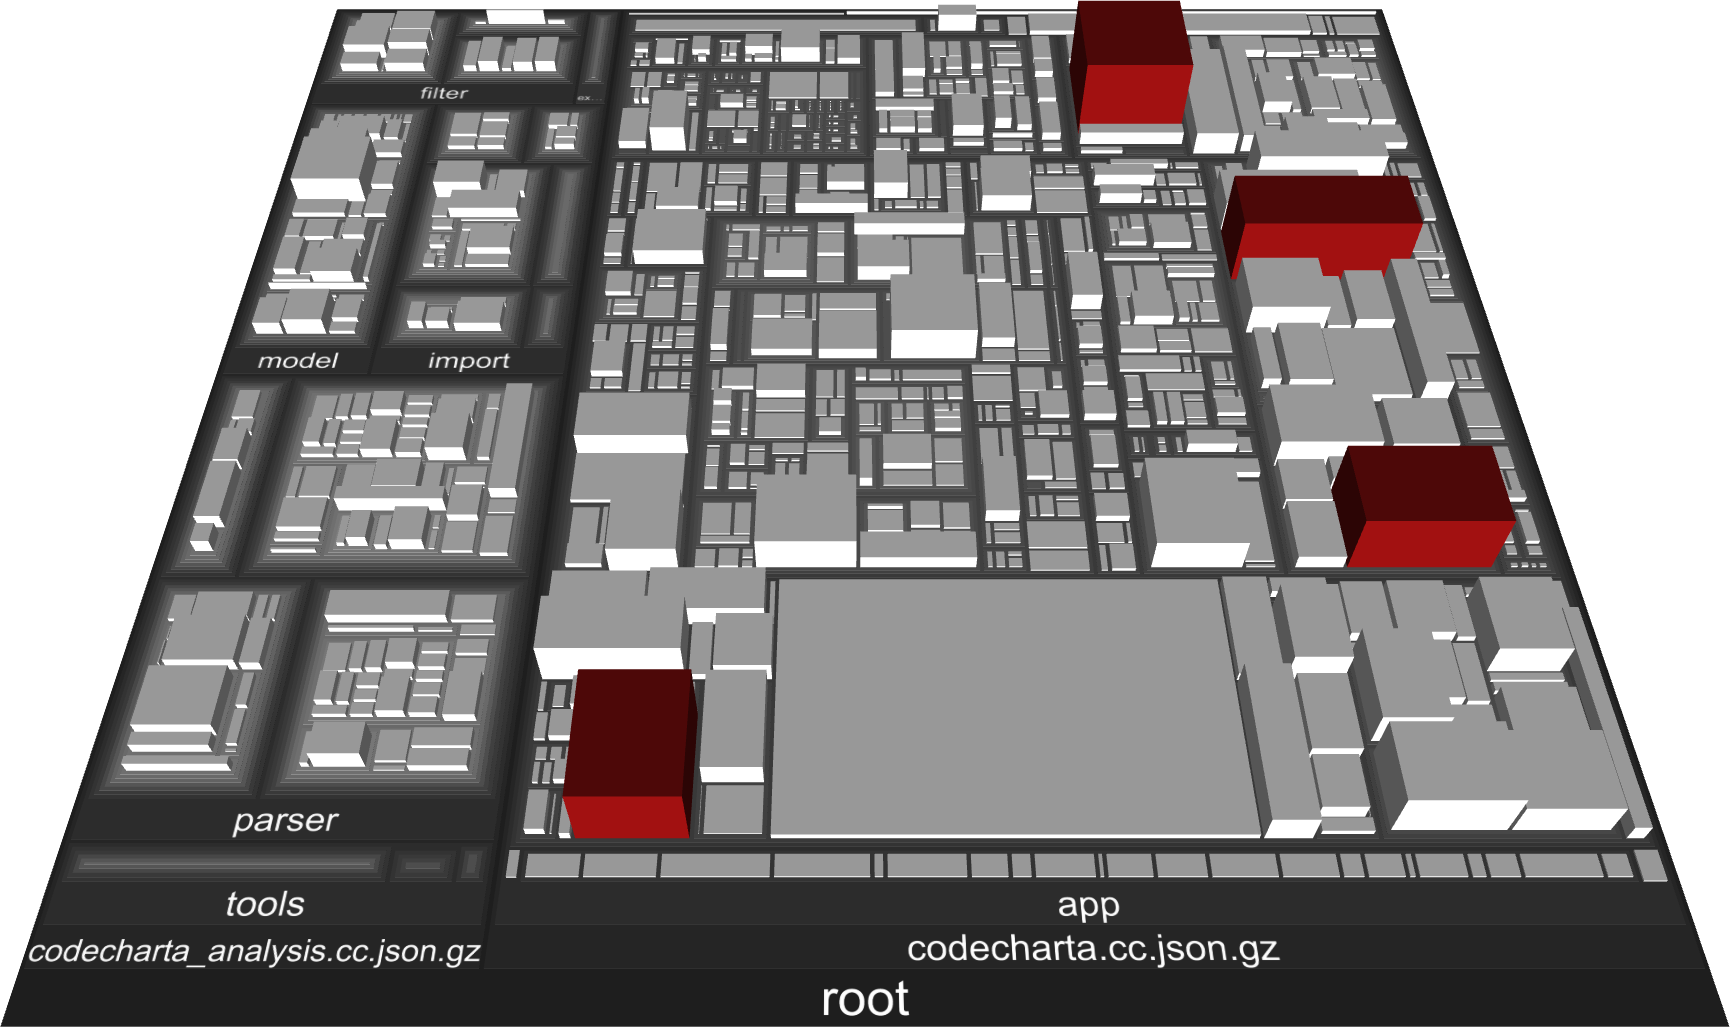
Find Hotspots
See hotspots at a glance and see what is important to you.
Track your changes
See how your codebase has grown ver time. Compare older maps to understand the impact your decisions had!
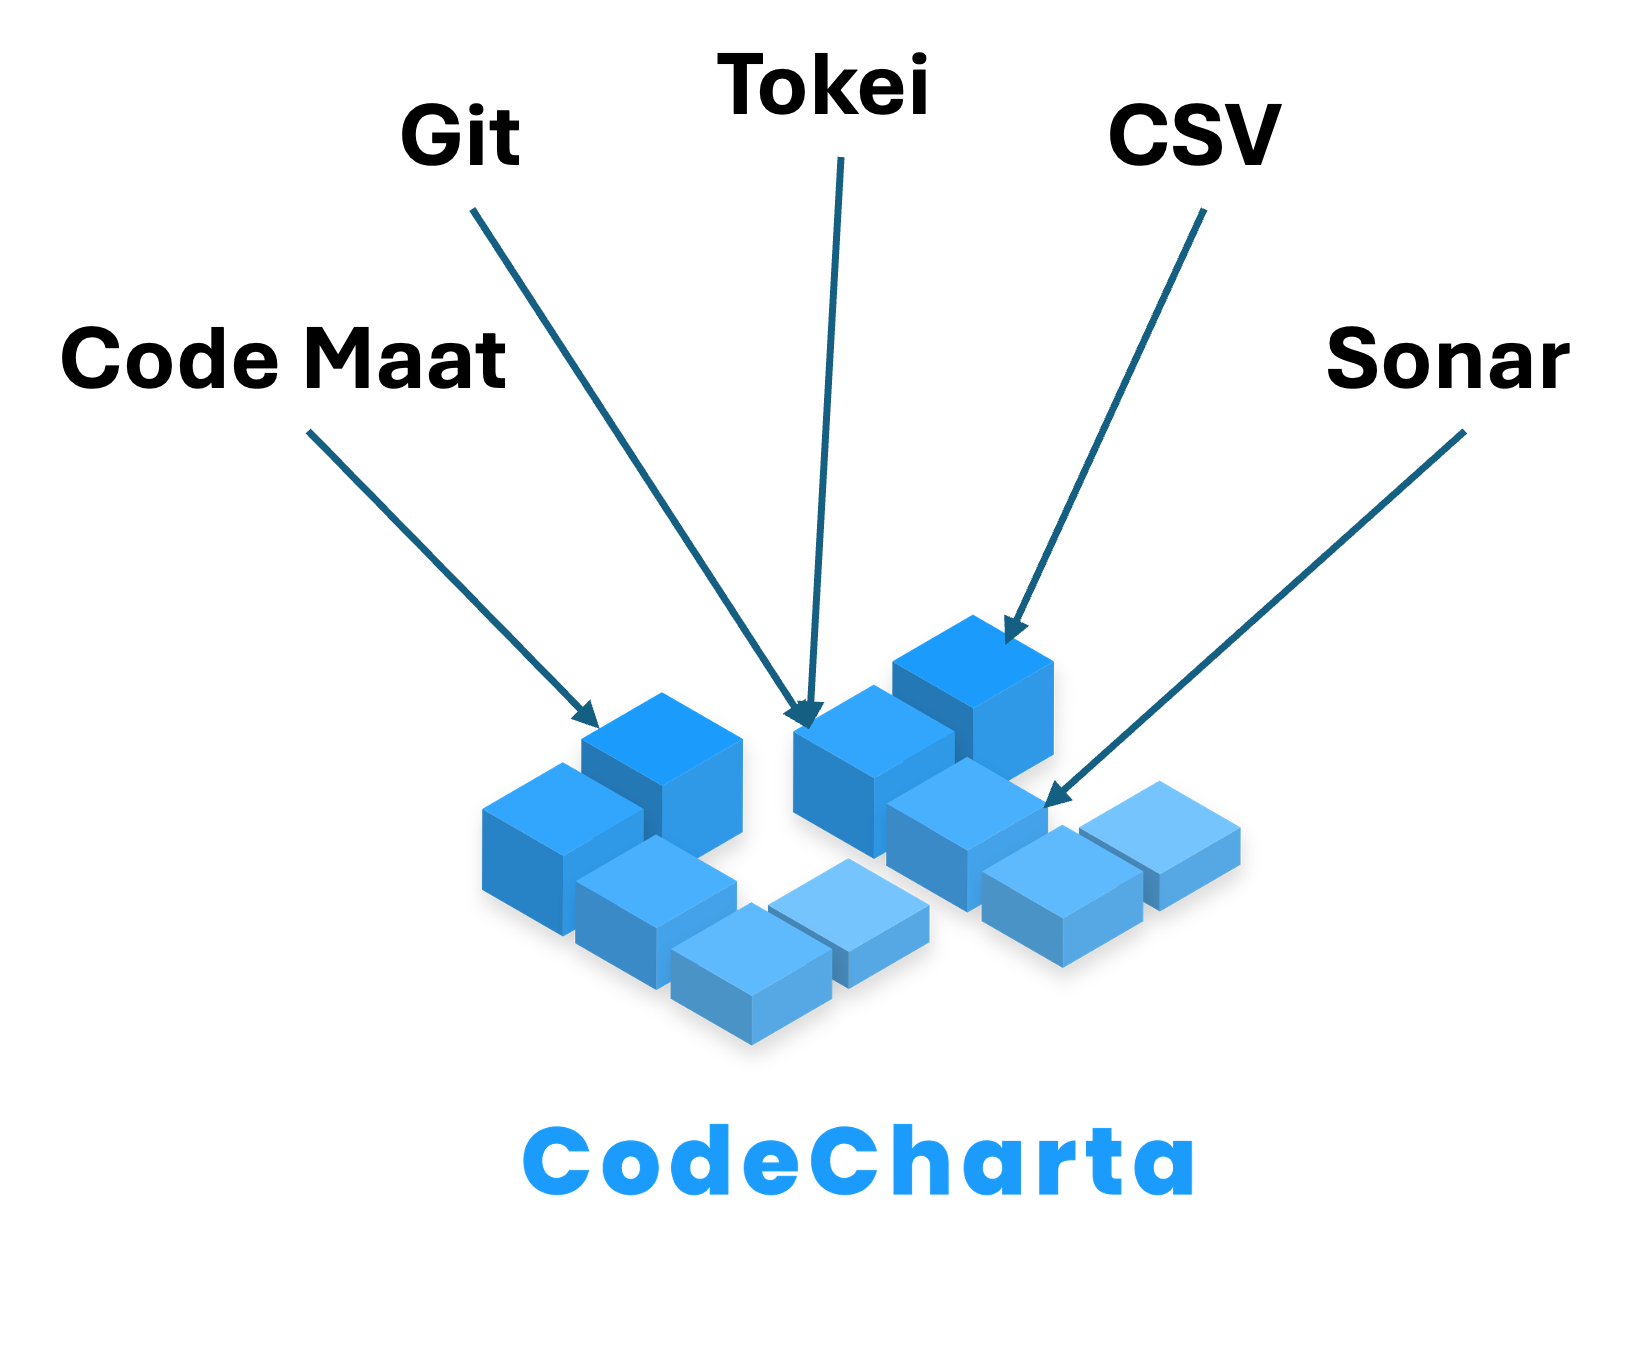
Seamless Import
You can get metrics from a lot of different parsers and importers.

Your Data Stays Local
All analysis and visualization happens on your machine. No data is ever uploaded or shared without your explicit intent. Your code stays private.
CodeCharta: Static Code Analysis & Codebase Visualization Tool!
Open-Source Static Code Analysis Meets 3D Code Maps
CodeCharta is an open-source static code analysis and code visualization tool that turns your codebase into an interactive 3D code map. Visualize your software architecture, code complexity, and technical debt to find code hotspots, conduct software health checks, and improve overall code quality. It’s professional yet approachable – designed for developers and companies to easily explore your codebase and uncover insights. Try it now and see your code in a whole new way.
Why CodeCharta?
- Visualize Your Entire Codebase: Transform millions of lines of code into a single codebase visualization. CodeCharta renders your project as a 3D code map, providing instant insight into your software architecture. Complex systems become easier to understand when you can literally see the structure and size of every module.
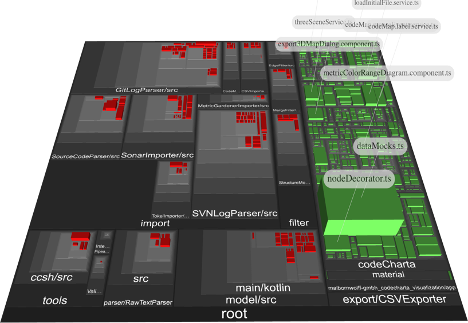
- Find Hotspots Fast: Identify problematic areas at a glance. Large or red-highlighted “buildings” on the map reveal code hotspots – files with high complexity, frequent changes, or other risk factors. This visual approach pinpoints potential hot-spots and technical debt locations, so your team knows where to focus refactoring efforts first.
- Improve Code Quality: Make better decisions with code maintainability metrics. CodeCharta aggregates static analysis data (lines of code, complexity, churn, duplications, etc.) to give you a measurable view of your current codebase, monitor improvements and assess the impact of bug fixes or optimizations with data-driven clarity. Track improvements over time and see the impact of bug fixes or optimizations on your code quality!
- Open-Source & Integrations: CodeCharta is free and open-source – use it with confidence in personal or enterprise projects. It’s lightweight and easy to integrate into CI pipelines, making it ideal for automated workflows. CodeCharta can also import metrics from tools like SonarQube, allowing you to visualize existing code quality data in new ways. Whether you’re working with SonarQube or small-scale static analysis tools, CodeCharta adapts flexibly to your setup. Get started with CodeCharta and join a growing community improving codebases worldwide.
Interactive 3D Code Maps for Software Architecture Visualization
CodeCharta uses a city metaphor to visualize code: each file becomes a “building” and each folder becomes a “district,” with dimensions representing metrics like lines of code or complexity. This interactive 3D map brings software architecture visualization to life, letting you explore your codebase structure in a way that’s intuitive and engaging. By rendering static analysis data into a visual form, CodeCharta turns abstract metrics into tangible shapes – a true code visualization tool for your team. You can quickly spot anomalies (e.g. an oversized class or a cluster of deeply nested files) that might be missed in traditional code reviews. It’s not just pretty visuals; it’s a practical map for navigating and understanding even the largest codebases.
Code Quality Metrics and Technical Debt Analysis
Static code analysis is more powerful when you can see the numbers. CodeCharta consolidates metrics from various analyzers into a unified view, giving you full technical debt analysis at your fingertips. Color-coding and height indicators on the 3D map serve as a technical debt visualization – for example, a toweringly tall building might indicate high complexity or legacy code that has accumulated debt over time. With built-in code maintainability metrics, you can perform a comprehensive software health check: identify modules with low maintainability, high complexity, or numerous issues. These insights help development teams prioritize improvements, reduce maintenance costs, and improve the overall quality of the software. In short, CodeCharta turns data into actionable intelligence for better code quality.
Find Code Hotspots in Legacy Code
Maintaining legacy code can be challenging, but CodeCharta makes legacy code analysis much easier. By visualizing historical and complexity data, the tool highlights code hotspots that merit attention. Areas of the codebase that are change-prone or error-prone stand out visually, alerting your team to sections that may hide bugs or architectural problems. This is especially useful for large older projects – instead of reading thousands of lines, you can quickly find code hotspots on the map and drill down only where it matters. CodeCharta’s approach reduces uncertainty in legacy system migrations and upgrades by clearly showing which parts of the codebase are healthy and which are problematic. Developers and project managers alike gain confidence knowing they’re focusing on the right parts of the system.
Open-Source Tool with SonarQube Integration
As an open-source code analysis tool, CodeCharta is free to use, extend, and integrate into your workflow. It’s built by developers for developers, with a passionate community behind it. SonarQube integration is baked in – you can easily import SonarQube’s static analysis results (code smells, duplication, issue counts, etc.) into CodeCharta to create rich visual maps. This means you get the best of both worlds: the rigorous analysis of SonarQube and the intuitive visualization of CodeCharta. The tool also supports selected data sources and formats—for example, metrics exported as CSV—making it possible to include insights from other static analysis tools depending on format compatibility. The powerful CLI enables automation in CI/CD pipelines (Jenkins, GitLab CI and more), so you can generate updated maps for every build or release. Because it’s open-source, there’s no vendor lock-in – you can adapt it to your needs or even contribute improvements. Get started with CodeCharta today and bring static code analysis to life with interactive visuals.
Start Exploring Your Codebase
Ready to transform the way you understand your software? CodeCharta empowers your team to explore your codebase like never before. From software architecture visualization to in-depth technical debt analysis, you’ll have the tools to improve maintainability and code quality. Don’t let hidden issues lurk in your repository – try CodeCharta now and map out a better, healthier codebase.