Visualization
The goal of the CodeCharta visualization is to make code quality more accessible and tangible to everyone. We use the city metaphor and represent each file in your source code with a building. This allows user to grasp complex metrics, even without knowing what they are in detail. This also provides a big picture view of code to experienced professionals and allows them free exploration of the code files and their metrics.
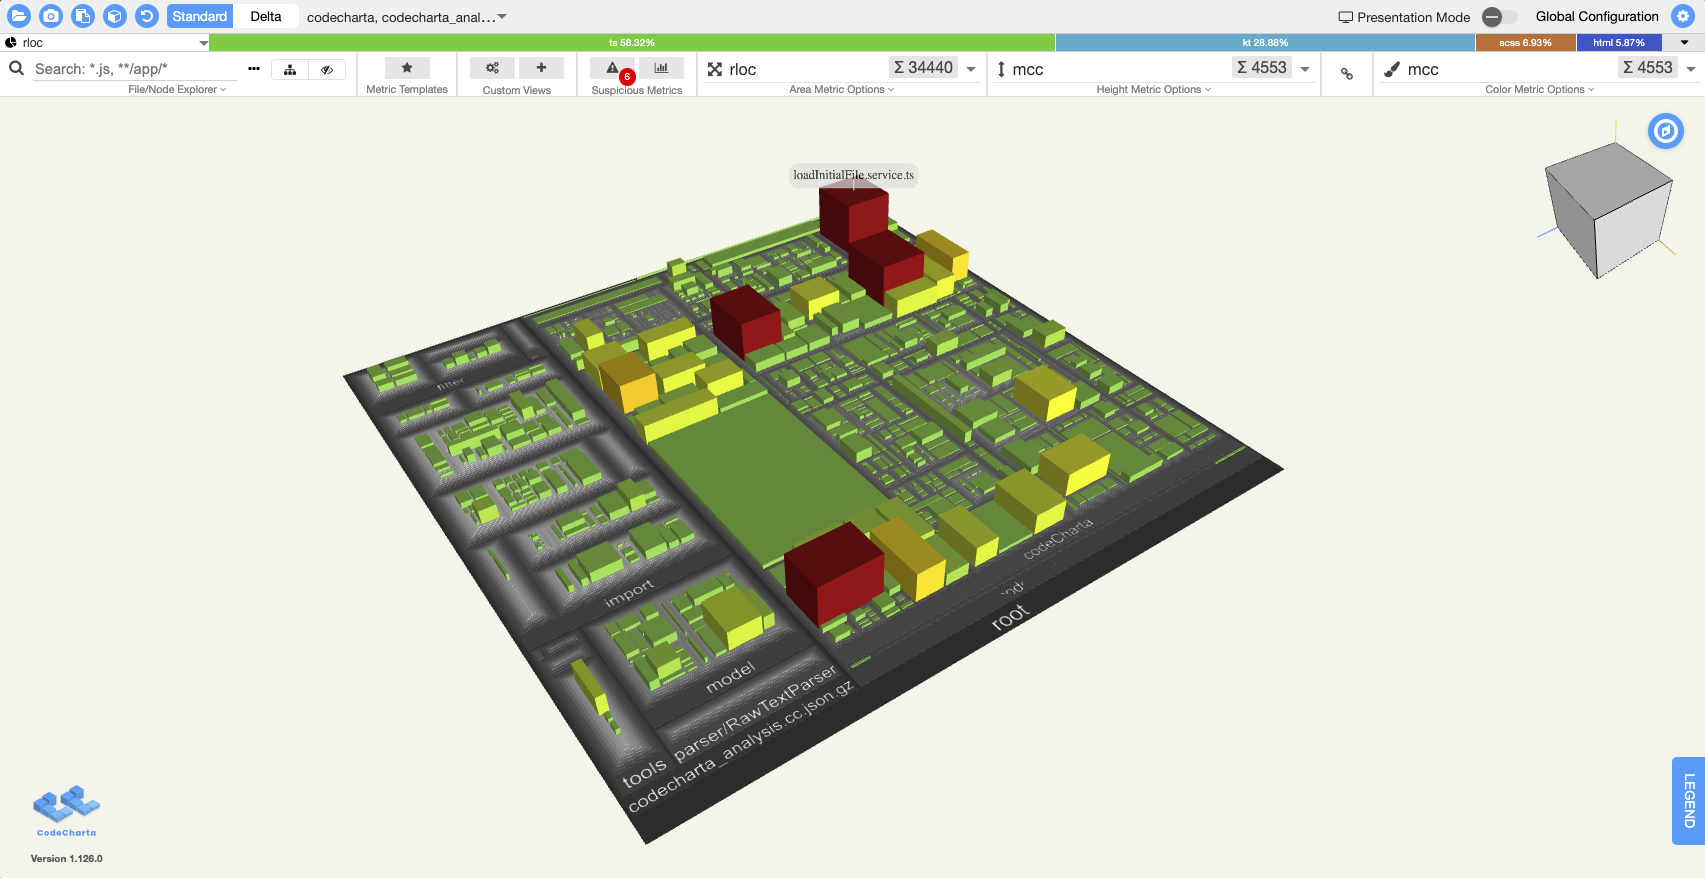
This is what you will find, once you open our Web Studio:

The main focus is the city-style map. Each building in it has the attributes size, height and color, which are selectable via drop down menus and can each represent a different metric. This way the visualization allows users to contrast multiple metrics at the same time. The default settings for these metrics looks like this:
- size
= rloc (real lines of code)
- height
= complexity (cyclomatic complexity)
- color
= complexity (cyclomatic complexity)
Note that the available metrics are tied to the cc.json used to load the map. Depending on which parser of our CCSH (CodeCharta Shell) was used to generate the map, different metrics might be available. For more information on what these names mean and which parsers produce which metrics, view the list of available tools in analysis.