Scenarios
A scenario is a saved bundle of visualization settings. Instead of adjusting the area, height and color metrics (and related view options) one by one, you apply a scenario and switch the whole view in a single click.
A scenario can store several groups of settings:
- Metrics – which metrics drive the building area, height and color (plus optional edge and distribution metrics, and whether height and color are linked).
- Colors – the color range, color mode and the positive/neutral/negative map colors.
- Camera – the camera position and target.
- Filters – the blacklist (hidden/excluded buildings) and the focused node path.
- Labels & Folders – label settings (size, amount, label mode, floor labels, etc.) and marked packages.
Open the scenario list from the SCENARIOS entry in the metric bar at the bottom of the screen (shown as ”+ / N scenarios available”). For more about the metric bar, see Metrics.
Built-in scenarios
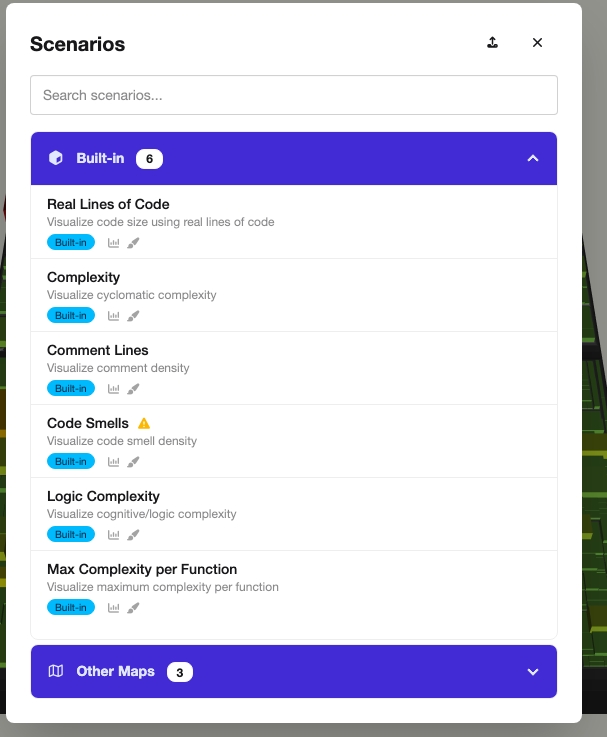
Section titled “Built-in scenarios”CodeCharta ships with six Built-in scenarios. Each one sets the area metric to Real Lines of Code and uses a meaningful metric for height and color, so you can inspect a common quality aspect immediately:
- Real Lines of Code – visualize code size using real lines of code.
- Complexity – visualize cyclomatic complexity.
- Comment Lines – visualize comment density.
- Code Smells – visualize code smell density.
- Logic Complexity – visualize cognitive/logic complexity.
- Max Complexity per Function – visualize the maximum complexity per function.
Built-in scenarios are always available, regardless of which map is loaded. If a scenario references a metric your current map does not contain, the entry shows a warning icon and the missing metrics are simply skipped when applying.
Applying & searching scenarios
Section titled “Applying & searching scenarios”The panel lists scenarios in groups. Besides Built-in, you may see:
- Current Map – your own scenarios that are bound to a map you currently have loaded.
- Global – your own scenarios that are not bound to any specific map.
- Other Maps – scenarios bound to maps that are not currently loaded. They stay listed so you can see them, but they apply to different files.
Use the search box at the top to filter scenarios by name or description.
Click a scenario to open the apply dialog. There you select which sections to apply (Metrics, Colors, Camera, Filters, Labels & Folders) using checkboxes, then confirm with Apply. This lets you, for example, apply only the metrics of a scenario without changing your camera or filters. If some metrics in the scenario are not available in the current map, a warning lists them and they are left unchanged.
Saving your own scenario
Section titled “Saving your own scenario”To save the current view as a scenario, use the Save Scenario dialog.
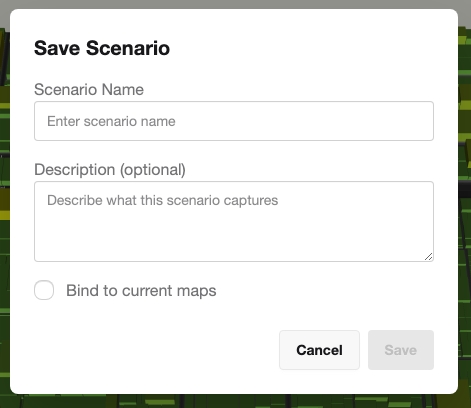
The dialog has the following fields:
- Scenario Name – required. The Save button stays disabled until a name is entered.
- Description (optional) – a short note describing what the scenario captures.
- Bind to current maps – optional checkbox. When checked, the scenario records the file names of the maps you currently have loaded. The scenario then appears under Current Map whenever those maps are loaded and under Other Maps otherwise. When unchecked, the scenario is saved as a Global scenario that is not tied to any map. The checkbox is disabled when no map is loaded.
Saving captures all current settings (metrics, colors, camera, filters and labels/folders). Custom scenarios are stored in your browser, so they persist across sessions on the same machine.
Managing custom scenarios
Section titled “Managing custom scenarios”Custom (non-built-in) scenarios can be exported and deleted directly from the list using the icons on each entry:
- Export – download the scenario as a file so you can share it or import it elsewhere.
- Delete – remove the scenario. You are asked to confirm before it is deleted.
Built-in scenarios cannot be edited or deleted; the export and delete actions are only shown for your own scenarios.
If you want more information about using the visualization, take a look at the user controls.