Labels
Labels annotate individual buildings on the map with their name and/or metric value, so you can read off the most relevant files without hovering over each one. Rather than labelling every building (which would be unreadable), CodeCharta labels only a configurable number of the most relevant buildings.
All label behavior is configured from the LABELS settings, opened from the gear icon next to LABELS in the metric bar. Labels belong to the 3D layouts; the Sunburst and Radial TreeMap layouts write the names into their segments instead and hide this entry.
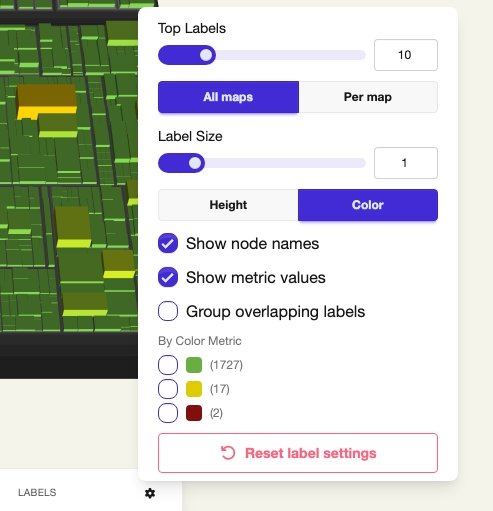
Top Labels
Section titled “Top Labels”Sets how many buildings receive a label (0–50). The buildings are ranked, and the highest-ranked ones up to this count are labeled. Set it to 0 to turn labels off entirely.
How buildings are ranked depends on the Height / Color choice below.
All maps / Per map
Section titled “All maps / Per map”This toggle only appears when more than one map is loaded.
- All maps: the Top Labels count is applied across all visible maps combined, so the most relevant buildings overall get a label.
- Per map: the Top Labels count is applied separately to each map, so every loaded map gets its own set of top labels.
Label Size
Section titled “Label Size”Scales the font size of the floating labels (range 0.75–2.5, in steps of 0.25). Increase it to make labels easier to read, for example when presenting on a projector.
Height / Color
Section titled “Height / Color”Chooses which metric ranking decides which buildings get labeled:
- Height: buildings are ranked by their rendered height, so the tallest buildings are labeled. This uses the rendered height rather than the raw value, so inverted-height or low-is-tall metrics still label the buildings that actually appear tallest on the map.
- Color: buildings are ranked by the color metric, and only buildings in the color categories selected under By Color Metric are considered. This lets you label, for example, the worst (red) buildings by a quality metric instead of the tallest ones.
This choice also determines which metric value is shown on the label: the color metric in Color mode, the height metric in Height mode.
Show node names
Section titled “Show node names”When enabled, each label shows the building’s (file) name. When disabled, the name is omitted from the label text.
Show metric values
Section titled “Show metric values”When enabled, each label shows the relevant metric value together with the metric’s name (the color metric in Color mode, otherwise the height metric).
At least one of Show node names or Show metric values must be enabled for labels to appear; with both disabled, no labels are drawn.
Group overlapping labels
Section titled “Group overlapping labels”When labels would overlap each other on screen, enabling this groups the colliding labels together so they stay legible instead of stacking on top of one another.
By Color Metric
Section titled “By Color Metric”This section is only shown in Color label mode (and not in Compare). It lists the three color categories of the current color metric (positive, neutral and negative), each with a color swatch and a live count of how many buildings fall into that category.
Tick a category to include its buildings as candidates for the Top Labels ranking; untick it to exclude them. A category with a count of 0 is disabled.
Reset label settings
Section titled “Reset label settings”Restores all of the above label settings (Top Labels, label size, the name and value toggles, color labels, label mode, grouping and the all-maps or per-map scope) back to their defaults.