Legend
The legend tells you what the map on screen means: which metric drives which dimension and which values each color stands for. Open it with the LEGEND tab at the bottom right; the same tab closes it, and so does a click anywhere outside the panel. The Metric and Dependencies views each have their own legend; the Domain view has none.
Legend of the Metric view
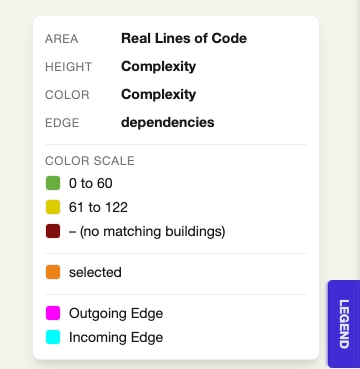
Section titled “Legend of the Metric view”The legend follows the metrics you pick in the metric bar.
- Area, Height, Color and, while an edge metric is active, Edge name the metric of each dimension by its full name, for example Real Lines of Code. Where the map describes a metric, hovering its name shows the description.
- Color scale lists the value range of the positive, neutral and negative band, for example
0 to 42,43 to 85and86 to 128. A band without buildings reads – (no matching buildings). - Selected is the color of the selected building.
- Outgoing Edge and Incoming Edge show the colors of the two edge directions while an edge metric is active.
In the Sunburst and Radial TreeMap layouts a folders row says how folders are colored. In Compare the metric rows and the color scale make way for the two Delta colors.
Legend of the Dependencies view
Section titled “Legend of the Dependencies view”The legend of the Dependencies view explains every mark the graph uses:
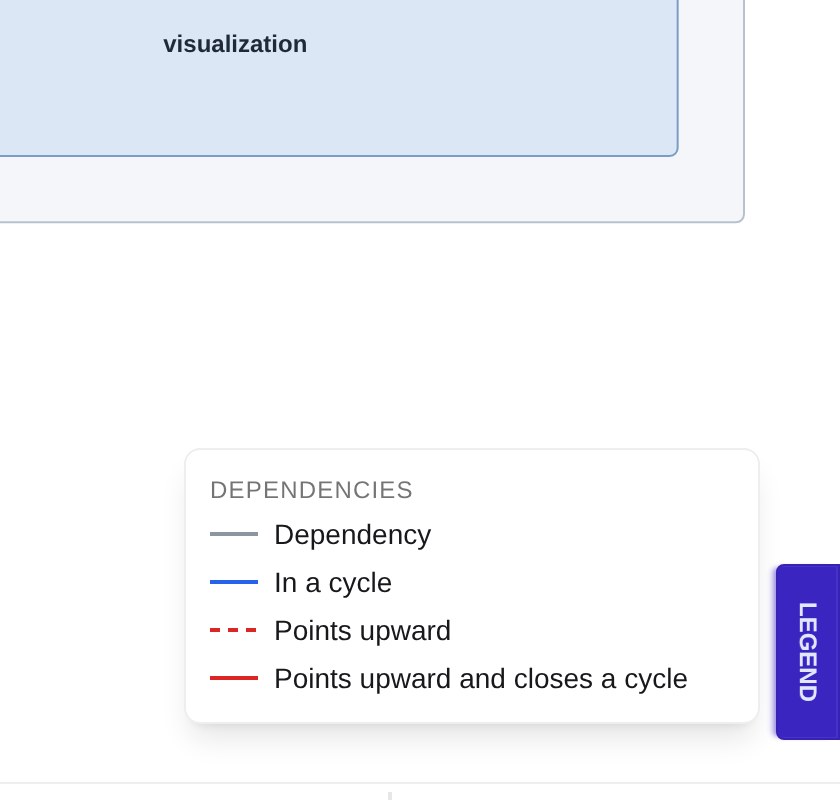
- Dependencies: the line of each edge type, in the colors set under Edges shown: Dependency, In a
cycle, Points upward and Points upward and closes a cycle. With another edge metric than
dependencies, this section is called Edges and shows the plain edge. - Kind of use: shown when Line style shows is set to Kind of use. The dash pattern and arrowhead of each kind, such as Inherits from, Implements, Creates or Returns.
- Badges: the badges a closed box can carry, such as Cycles between files and Upward dependencies inside.
- Declarations: the icon of each declaration kind, such as Class, Interface or Function, for a map with declarations.
Legend in screenshots
Section titled “Legend in screenshots”In the Metric view, an open legend is part of the screenshot. Because a click on the Screenshot button closes the legend first, take the screenshot with the keyboard instead: Ctrl+Alt+S saves it, Ctrl+Alt+F copies it. See Keyboard and mouse shortcuts.