User Controls
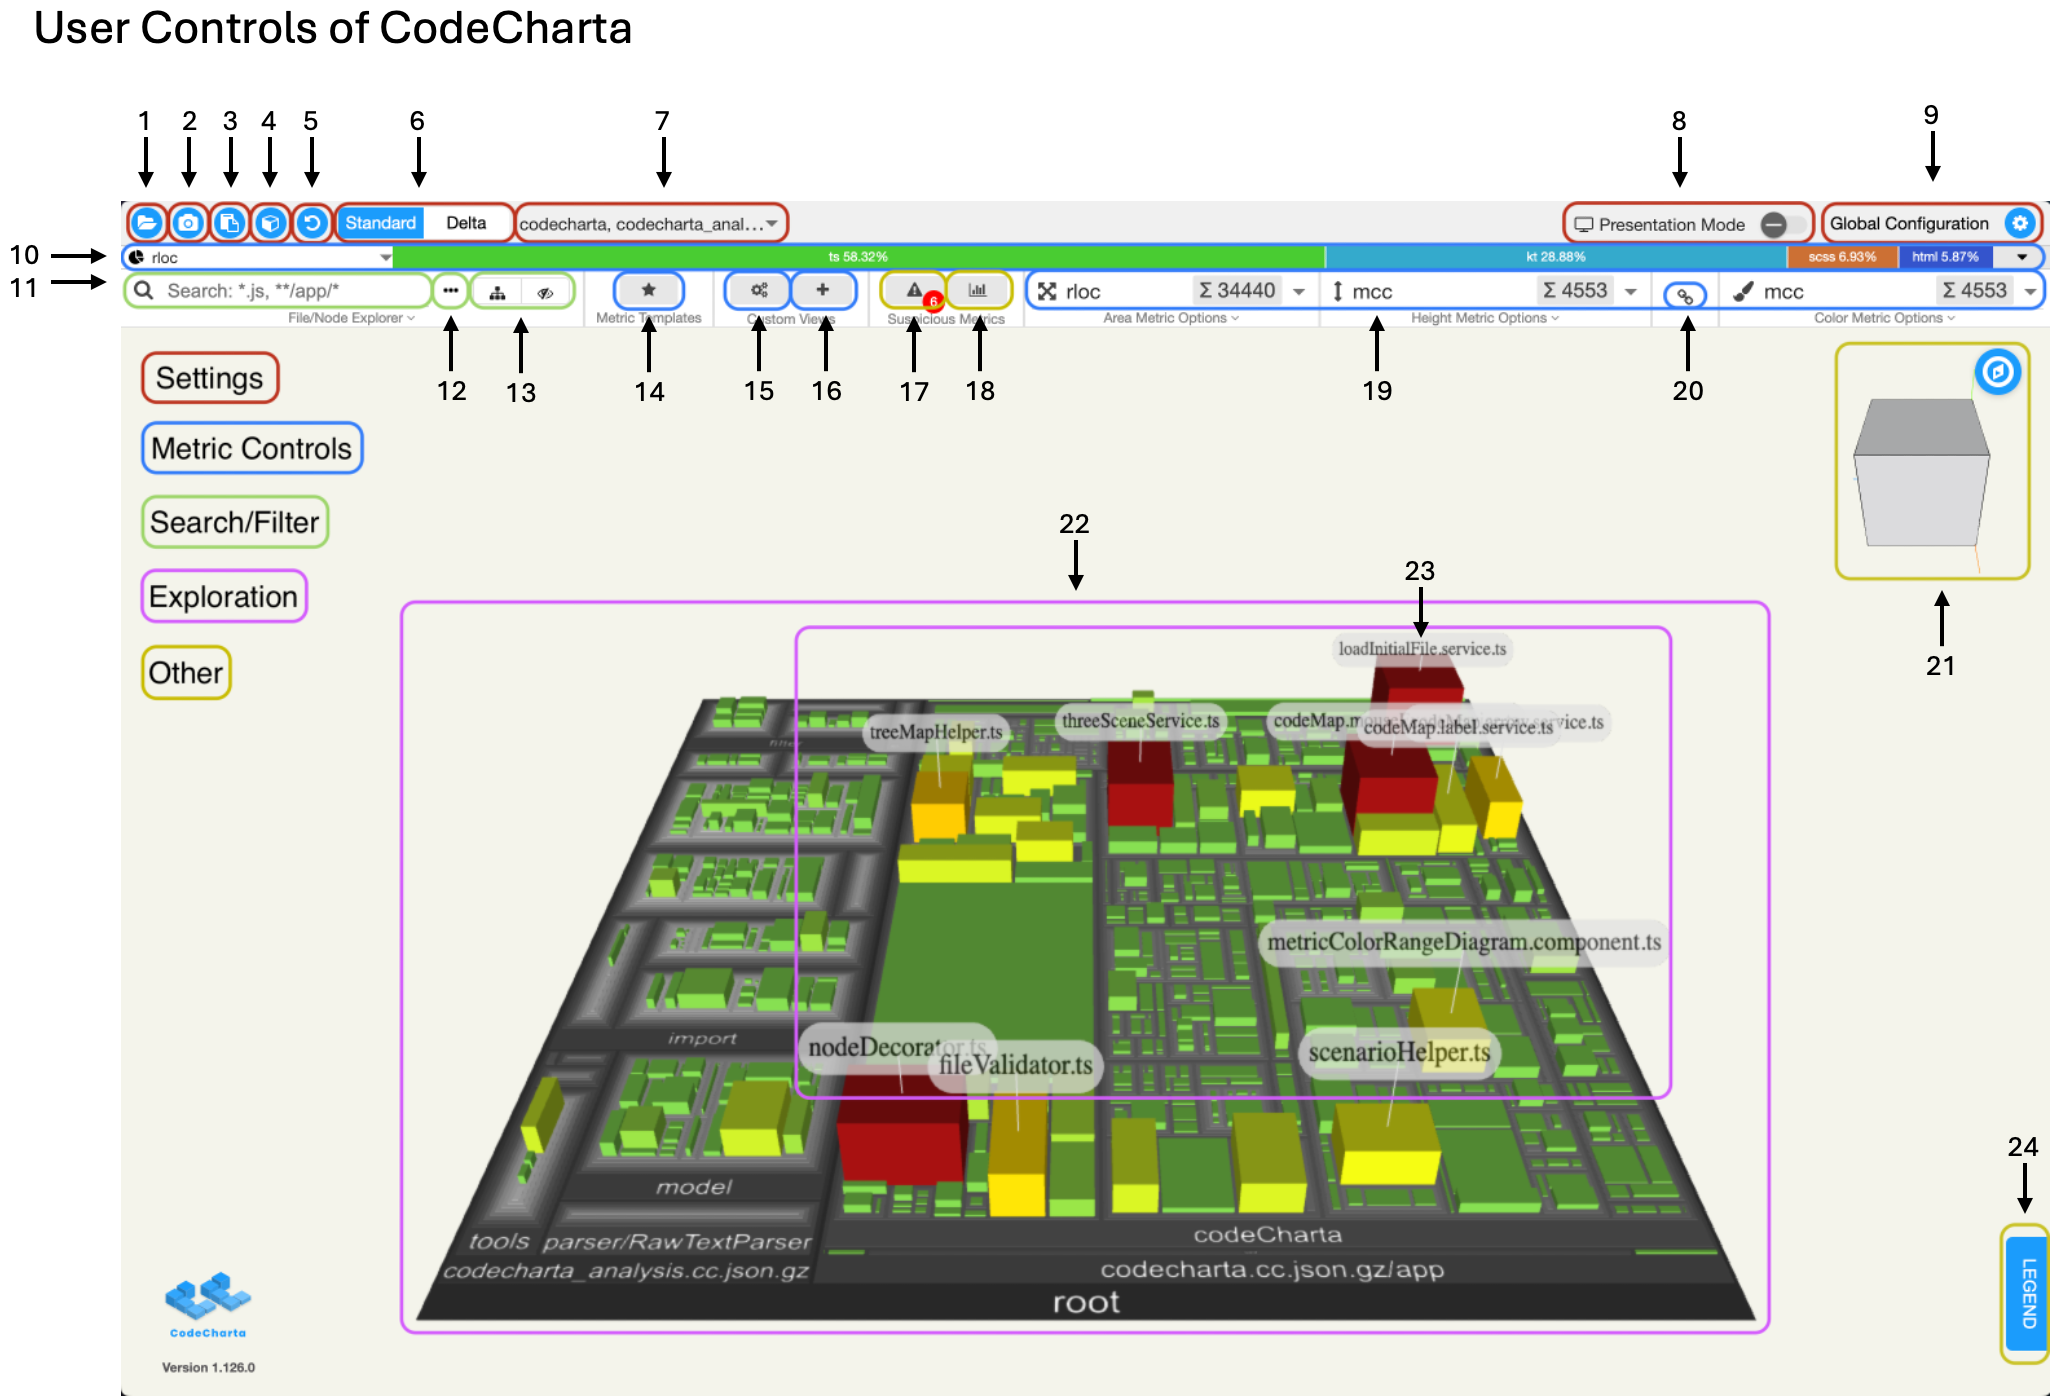
The controls that are available to you are listed below. Where a control has a dedicated page, follow the link for the full details.
| # | Control | What it does |
|---|---|---|
| 1 | Open / load maps | The folder button next to the logo loads a cc.json map, or multiple maps at once (hold shift). See Upload. |
| 2 | Map selector | Choose which of the loaded maps is shown. The button shows the selected map’s name (and a +1 count when several are selected). See Change Maps. |
| 3 | Explore | The default viewing mode for freely navigating and inspecting a single map. See Explore. |
| 4 | Compare | Switch to delta mode to see the difference between two loaded maps. Needs at least two maps loaded. See Compare. |
| 5 | 3D Print | Export the map currently on screen as a printable 3MF/STL model. See 3D Print. |
| 6 | Settings | Open the Global Configuration dialog (map layout, background color, quality and experimental features). See Settings. |
| 7 | Viewcube toolbar | The row of three buttons above the cube: compass (recenter/fit the map), camera (take a screenshot), and lightbulb (toggle the presentation flashlight hover effect). See Viewcube. |
| 8 | Viewcube & zoom | Click a face or edge of the cube to snap the camera to that perspective, drag to orbit, and use the zoom slider beside it to zoom in and out. See Viewcube. |
| 9 | Explorer counters | The SHOWN, FLATTENED and HIDDEN counters summarize how the rules divide up the map. Clicking FLATTENED or HIDDEN lists and lets you remove those rules. See Explorer. |
| 10 | Search & filter | Search for buildings with .gitignore-style patterns; the ⋮ menu applies the matches as Flatten or Exclude rules. See Explorer. |
| 11 | Sort | Change how the file tree is ordered (for example by name). |
| 12 | File tree | The searchable tree of folders and files in the loaded map; each row shows the share of the map it accounts for. See Explorer. |
| 13 | Code map | The central 3D treemap. Hover a building to highlight it and show its metrics; click it to open the Inspector sidebar with full details. See Map. |
| 14 | Area metric | Select the metric that drives each building’s footprint (base size). See Metrics. |
| 15 | Height metric | Select the metric that drives each building’s height. See Metrics. |
| 16 | Link height & color | Tie the height and color dimensions to the same metric; click again to unlink. See Metrics. |
| 17 | Color metric | Select the metric that drives each building’s color. See Metrics. |
| 18 | Labels | Control which buildings are labelled on the map and how many. See Labels. |
| 19 | Scenarios | Save and apply preconfigured combinations of metrics and view settings (“9 scenarios available”). See Custom Views. |
| 20 | Legend | Open the LEGEND panel, which decodes the current metric mapping and color ranges. A screenshot taken with it open includes it. See Legend. |
| 21 | Distribution bar | The thin bar at the very bottom shows how the selected area metric is distributed across file extensions. See File Extension Bar. |
| 22 | Explorer panel | The collapsible Explorer side panel on the left that holds the counters, search and file tree; use the « arrow in its header to show or hide it. See Explorer. |