
Compare
Compare mode (also called delta mode) shows the difference between two loaded maps instead of a single map. Each building is rendered as the delta of its metrics, so you can see at a glance which files grew, shrank, were added, or stayed the same between the two maps.
To use Compare you need at least two maps loaded (load multiple cc.json files by holding shift while selecting them, or merge them beforehand). Once two maps are available, switch on Compare from the Compare entry in the top navigation bar. When it is active, the top bar shows two map selectors with a swap control between them, and the map is recolored to show the delta.
Selecting the two maps
Section titled “Selecting the two maps”Compare works on two map slots shown side by side in the top bar:
- Reference (left slot) — the baseline map you compare from.
- Comparison (right slot) — the map you compare to.
Each slot is a dropdown listing the maps you have loaded; pick the reference on the left and the comparison on the right. The delta is then computed as the difference between the comparison map and the reference map.
Between the two slots is a swap button (the horizontal double-arrow icon). It exchanges the reference and comparison maps, which flips the direction of the comparison — what was previously an increase becomes a decrease and vice versa. The swap button is only enabled once a comparison map has been selected.
Reading the delta
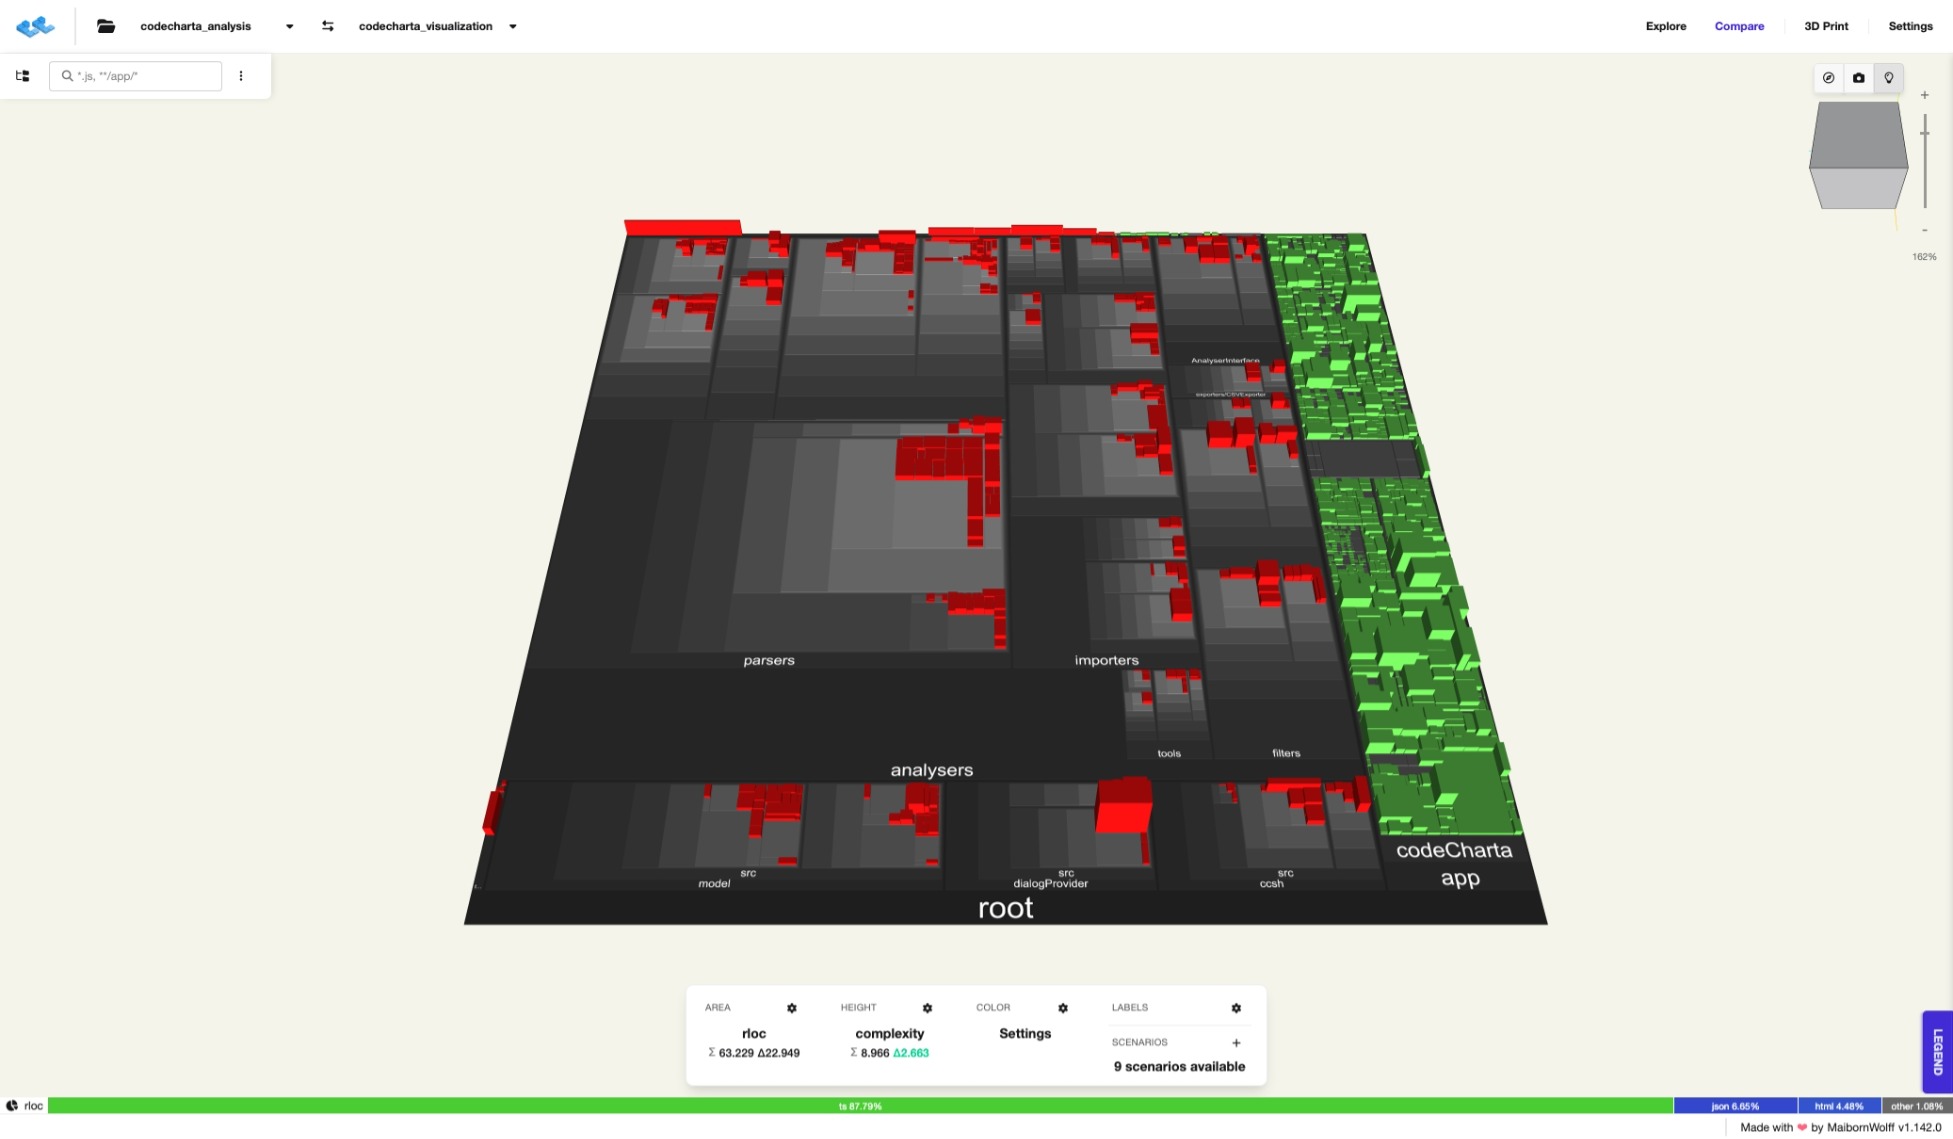
Section titled “Reading the delta”In Compare mode the building colors no longer represent the color metric. Instead, each building is colored by how its height metric changed between the two maps:
- Green — the height metric increased (positive delta). This is the
positiveDeltacolor (default#64d051). - Red — the height metric decreased (negative delta). This is the
negativeDeltacolor (default#ff0E0E). - Grey — the building is unchanged (no delta), or it is flattened.
These are the default semantics: by default an increase in the height metric is green and a decrease is red. You can flip them by inverting the delta colors in the color settings, in which case the meaning of green and red is reversed. The legend reflects the current assignment, labeling the two colors “+Δ positive delta” and “–Δ negative delta”.
At the bottom of the screen the metric bar shows the delta numerically. Alongside the summed metric value (Σ), each metric displays its delta with a Δ prefix — for example Σ 63.229 Δ22.949 for the area metric and Σ 8.966 Δ2.663 for the height metric in the screenshot above. These Δ values tell you, in absolute numbers, how much each selected metric changed between the reference and the comparison map.