Metric bar
The metric bar at the bottom of the Metric view decides which metric drives each visual dimension of the code map. Pair a size metric with a quality metric, such as lines of code for the area and complexity for height and color, and the hotspots stand out on their own.

The bar has one column per dimension:
- Area: the footprint of each building.
- Height: how tall each building is.
- Color: the color of each building.
- Edges: shown only when the map carries edges. See Edges.
- Labels and Scenarios: see Labels and Scenarios.
Each metric column shows the chosen metric and its sum (Σ) over the map; while a building is hovered or selected, it shows that building’s value instead. Click the metric name to pick another one from a searchable list, or the gear icon for the settings of that dimension.
The tab on the left edge of the bar switches the map layout. See Map layouts. The tab on the right edge holds the map tools.
The area metric sets the footprint of every building: larger values make larger buildings. Real lines of code
(rloc) is a common choice.
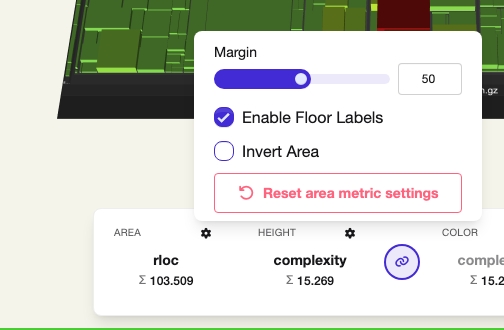
- Margin: the space between buildings, in percent (1 to 100). A larger margin makes single files easier to tell apart.
- Enable Floor Labels: writes the folder names onto the floors of their districts.
- Invert Area: small values become large buildings and the other way round.
- Reset area metric settings: restores the defaults.
Height
Section titled “Height”The height metric decides how tall each building rises.
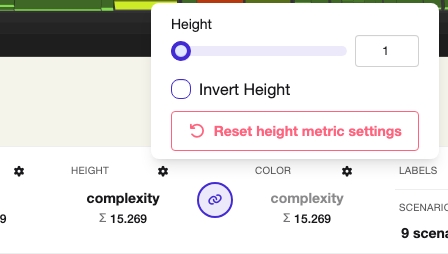
- Height: a scaling factor (1 to 25) that stretches or flattens the whole map.
- Invert Height: low values become tall buildings. Not offered in Compare.
- Reset height metric settings: restores the defaults.
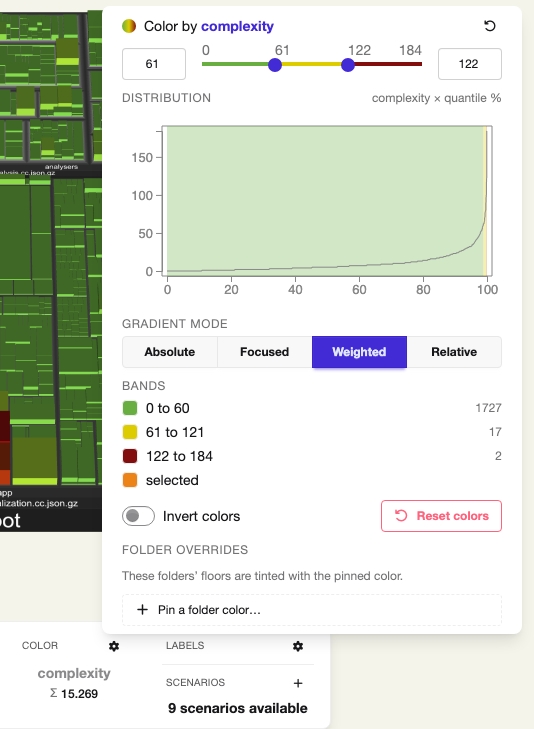
The color metric tints each building on a scale from a positive (green) to a negative (red) color. The settings are headed Color by and the metric name.
Color range and distribution
Section titled “Color range and distribution”The range slider has two thumbs that split the values into three bands: positive below the left thumb, neutral between the thumbs, negative above the right thumb. The number fields on both sides set the thresholds exactly, and the reset icon in the header puts them back. The Distribution chart below plots the metric over all files (value against quantile), so you can see where the values cluster before you place the thresholds.
Gradient mode
Section titled “Gradient mode”Gradient Mode decides how colors blend between the thresholds:
- Absolute: three solid bands without blending.
- Focused: a gradient inside the selected range only; values outside take the solid positive or negative color.
- Weighted: a gradient whose transitions widen with the range. The default.
- Relative: one continuous gradient from the lowest to the highest value.
3D Print needs Absolute.
Bands, invert and reset
Section titled “Bands, invert and reset”Bands lists each band with its value range and the number of buildings in it, plus the color of a selected building. The swatch of each band changes its color.
- Invert colors: swaps the positive and negative colors.
- Reset colors: restores the default colors.
Folder overrides
Section titled “Folder overrides”Pin a folder color… under Folder Overrides tints the floor of a folder with a fixed color, for example to mark the area of one team. The buildings inside keep their metric colors. Pinned folders are listed here and can be recolored or unpinned one by one. The context menu of a folder offers the same colors. See Context menu.
When the map contains edges, such as files that change together, an Edges column appears. Its name opens the list of edge metrics; the value below shows the incoming and outgoing edges. Hovering or selecting a building draws its edges for the selected edge metric.
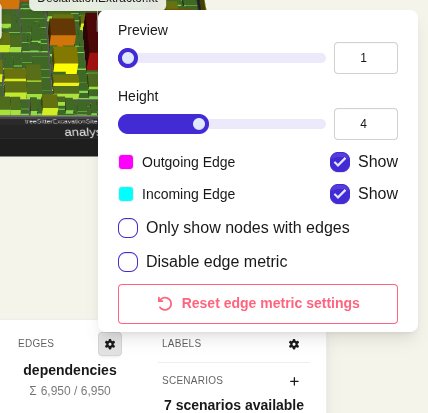
- Preview: how many buildings have their edges drawn without being hovered, starting with those with the most edges.
- Height: how high the edge arcs rise above the map (1 to 9).
- Outgoing Edge / Incoming Edge: the color of each direction, and Show to hide one of them.
- Only show nodes with edges: hides every building without an edge for the selected metric.
- Disable edge metric: switches the edges off and keeps the column.
- Reset edge metric settings: restores the defaults.
The Dependencies view draws dependency edges as a graph instead.
Linking height and color
Section titled “Linking height and color”The link button between Height and Color ties both to the same metric: changing one changes the other. Click it again to choose them separately.