Dependency View
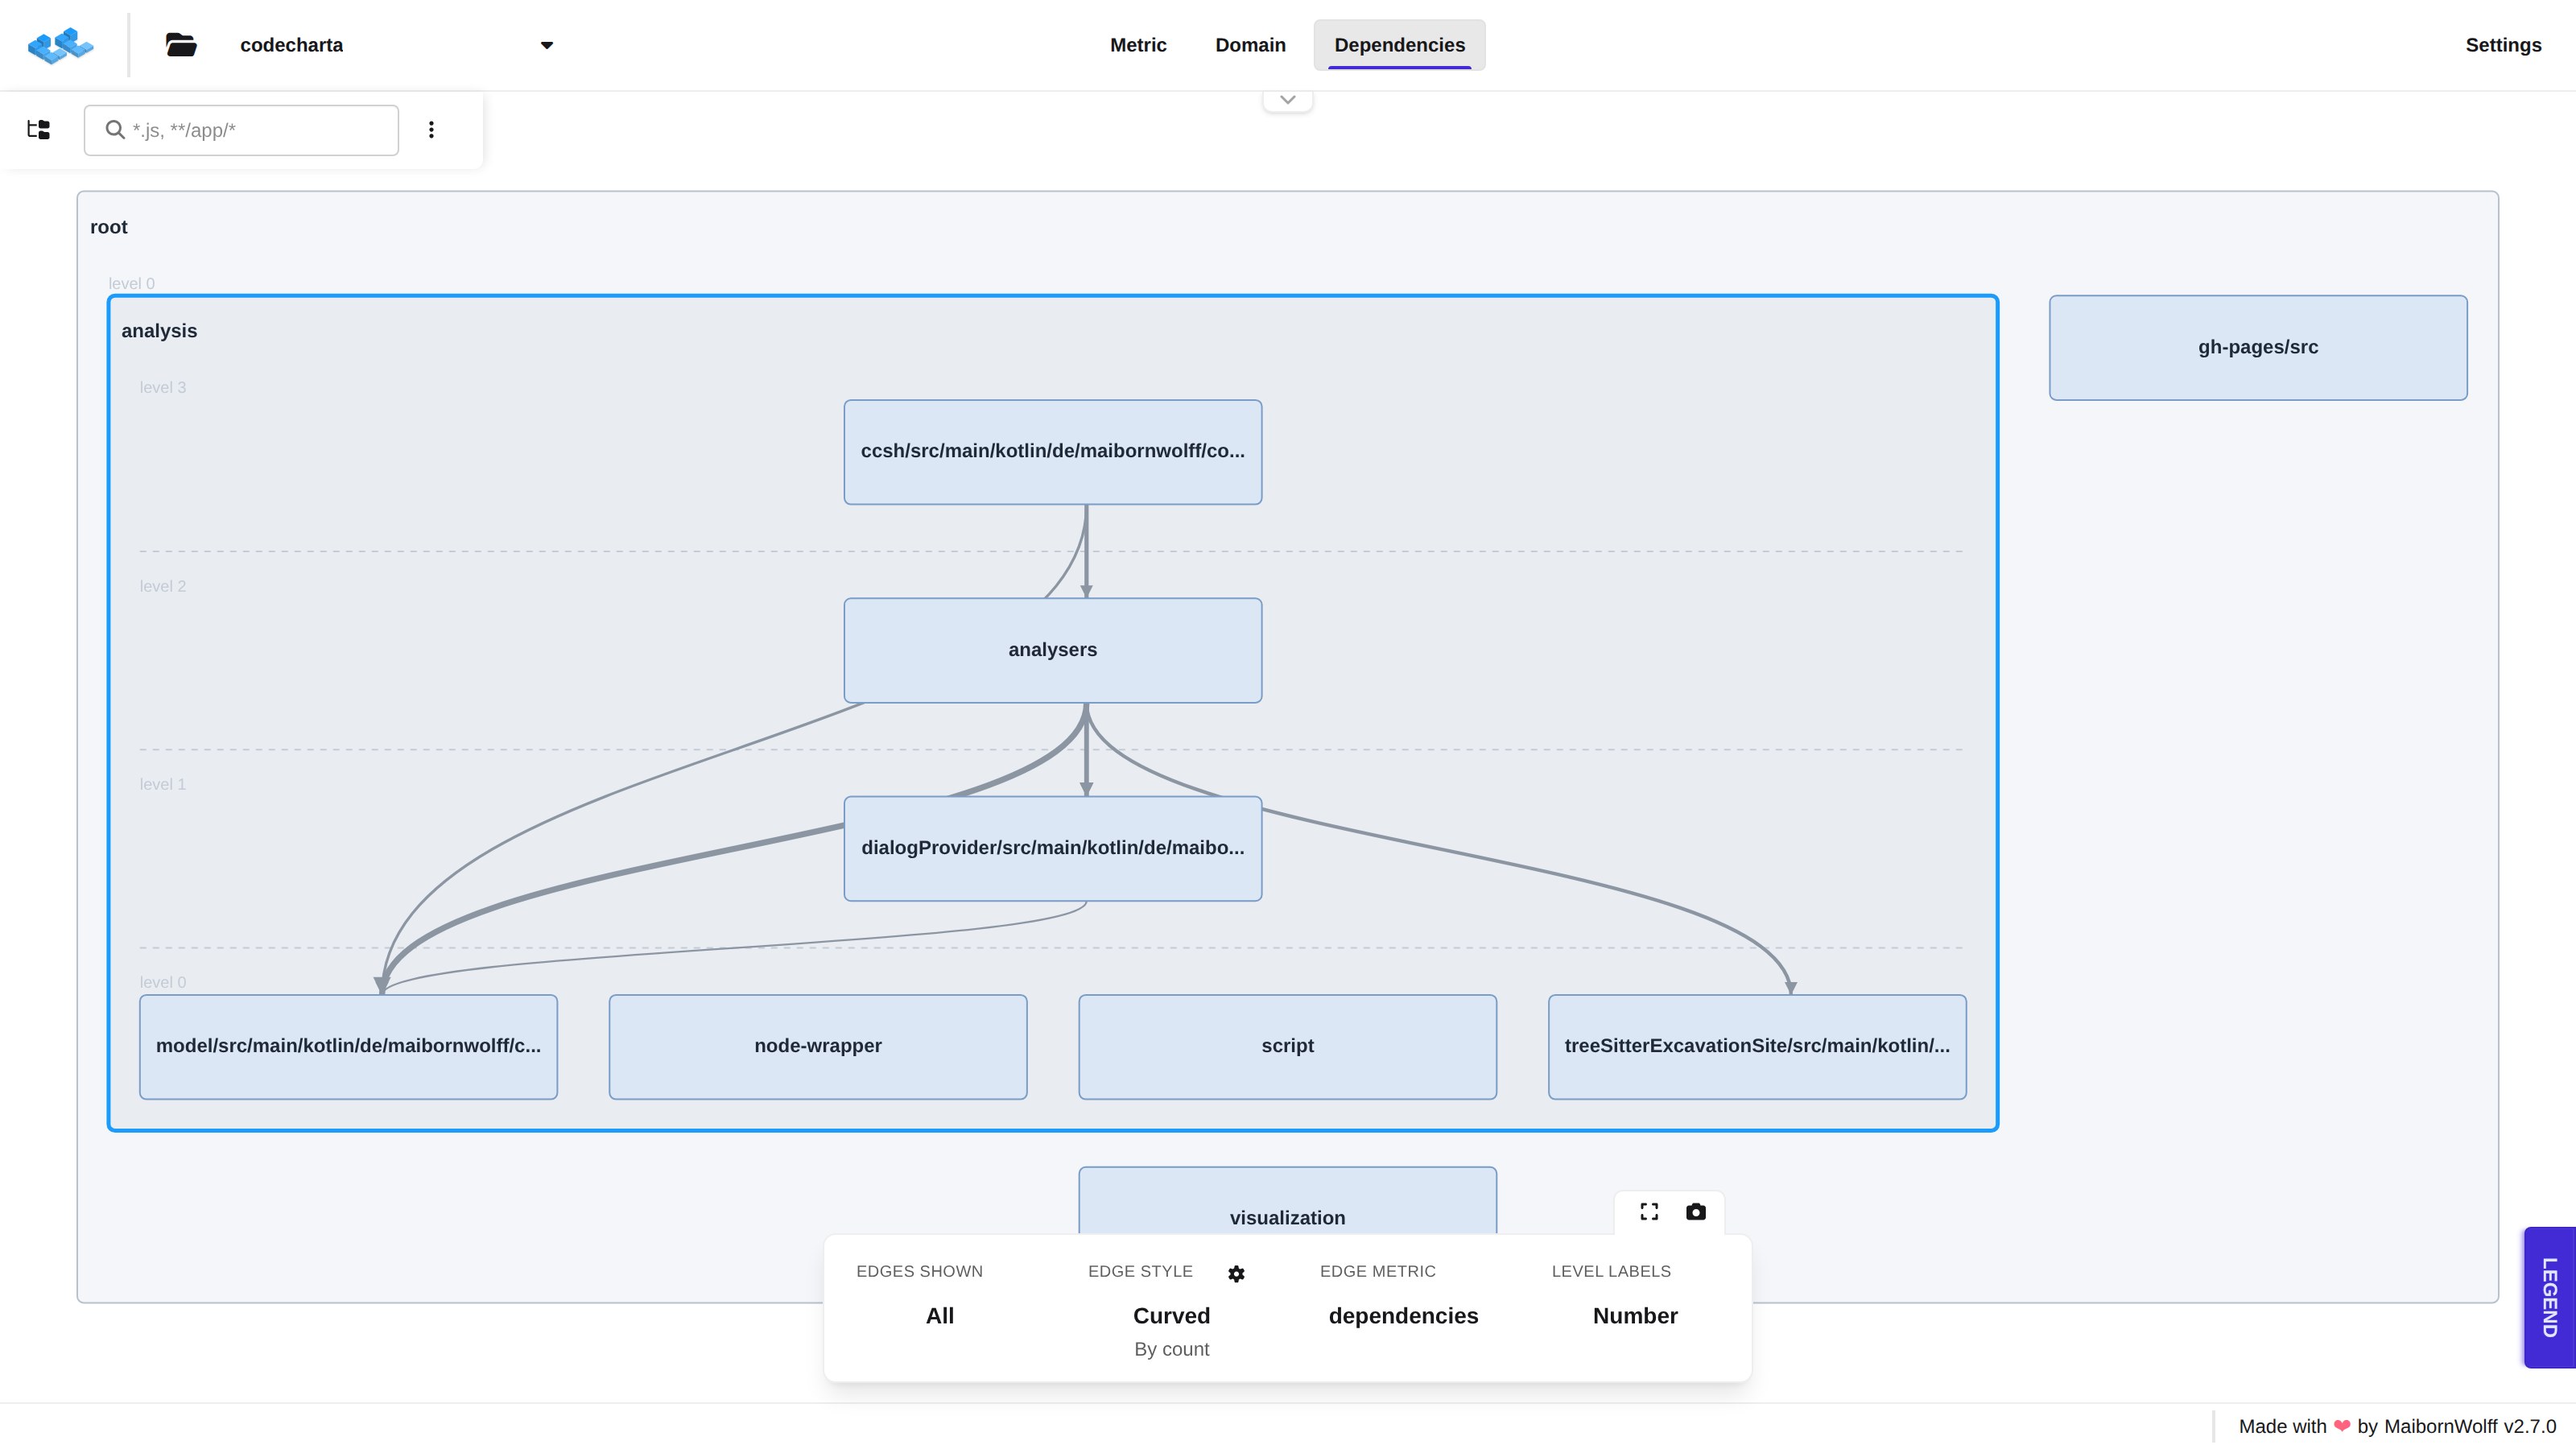
The Dependencies view draws the dependencies between the files and folders of a map as a graph, arranged by level: what a box depends on lies below it.
Opening the view
Section titled “Opening the view”The Dependencies tab appears in the top bar when two things are true:
- The loaded map carries dependency data. Create it with the Dependency parser (
ccsh dependencyparser). The sample map and the online demo include it. - Enable Dependency View (experimental) is switched on in the Settings.
Reading the graph
Section titled “Reading the graph”- Boxes are folders and files. A closed folder stands for everything inside it.
- Levels stack the boxes of a folder: a box on a higher level depends on boxes on lower levels. Dashed lines separate the levels, each labelled at its left end.
- Edges are dependencies. An edge between two closed folders stands for all dependencies between their contents, and by default it is drawn thicker the more of them it stands for.
In a cleanly layered codebase every edge points downward. The edges that do not are the interesting ones, and the LEGEND tab at the bottom right explains how they are marked:
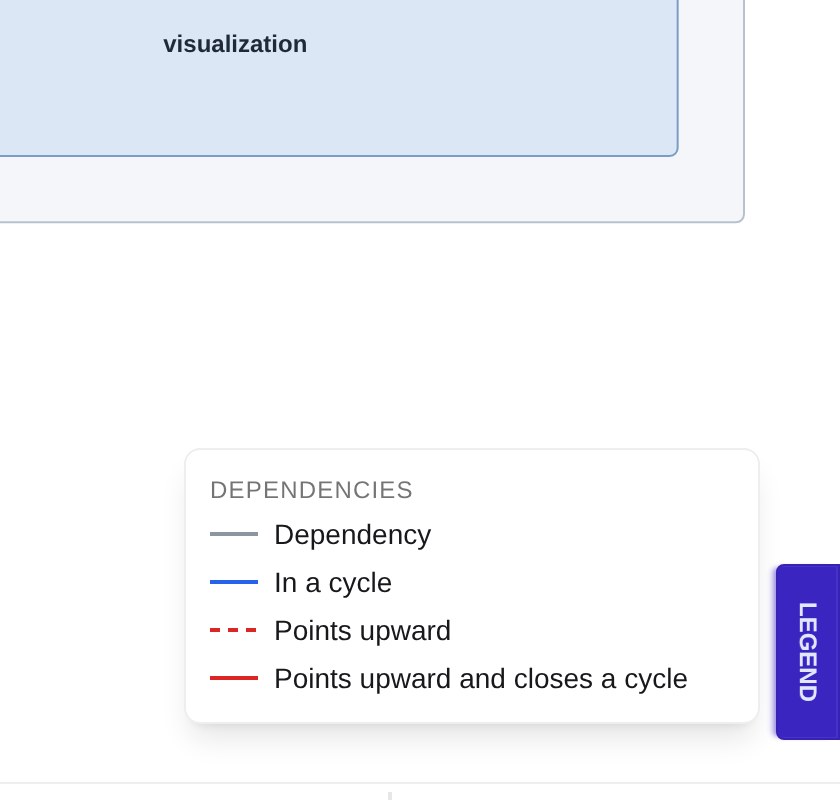
- Dependency (grey) – follows the levels.
- In a cycle (blue) – part of a dependency cycle, but still pointing downward.
- Points upward (red, dashed) – a dependency between folders that goes against the levels.
- Points upward and closes a cycle (red) – the dependency that closes a cycle.
Working with the graph
Section titled “Working with the graph”- Double-click a folder to open it and see its contents level by level; double-click it again to close it.
- Hover a box to see its path.
- Drag a box to move it out of the way. Reset layout in the tools tab puts every dragged box back.
- Right-click a box for its context menu: Show in Explorer, Show in Metrics / Show in Domain, Focus (folders) and Exclude.
- Show whole graph in the tools tab fits the graph back into the view, and Screenshot takes a picture of it. See Map Tools.
The Explorer on the left lists the files that take part in the graph. Its search and its Exclude rules work as in the Metric view; exclusions and the focus are shared with the other views.
The dependency bar
Section titled “The dependency bar”The bar at the bottom controls which edges are drawn and how:
-
Edges shown – tick which kinds of edges are drawn, with All, None and Invert as shortcuts. With none ticked, only the edges of the box under the pointer show.
-
Edge style – how edges are routed:
- Curved – edges leave and enter each box square to its side.
- Spread – curved, each edge with its own spot on the box.
- Upward aside – upward edges bow out to the right of the boxes.
- Straight – a straight line from box to box.
Start and end at the middle of the side bundles the edges of a box at one point. The gear icon opens the line thickness — By count, Thin, Uniform or Strong — and a Width factor, plus Reset edge style.
-
Edge metric – which edge metric of the map the graph draws.
-
Level labels – label the levels by Number (
level 0,level 1, …) or by Path, which names the levels of nested folders by the folders around them.